
Many people aren’t very familiar with Excel functions. They see others writing formulas but don’t know where to start themselves. Today, I’ll introduce five of the most commonly used functions for summing and calculating statistics: SUM, AVERAGE, COUNT, SUMIF, and SUMIFS. These functions have helped me solve almost all my numerical analysis problems.
SUM Function
SUM is a summation function—it was the first function I ever learned, and its purpose is simple: to add up a set of numbers.
Structure:=SUM(range)
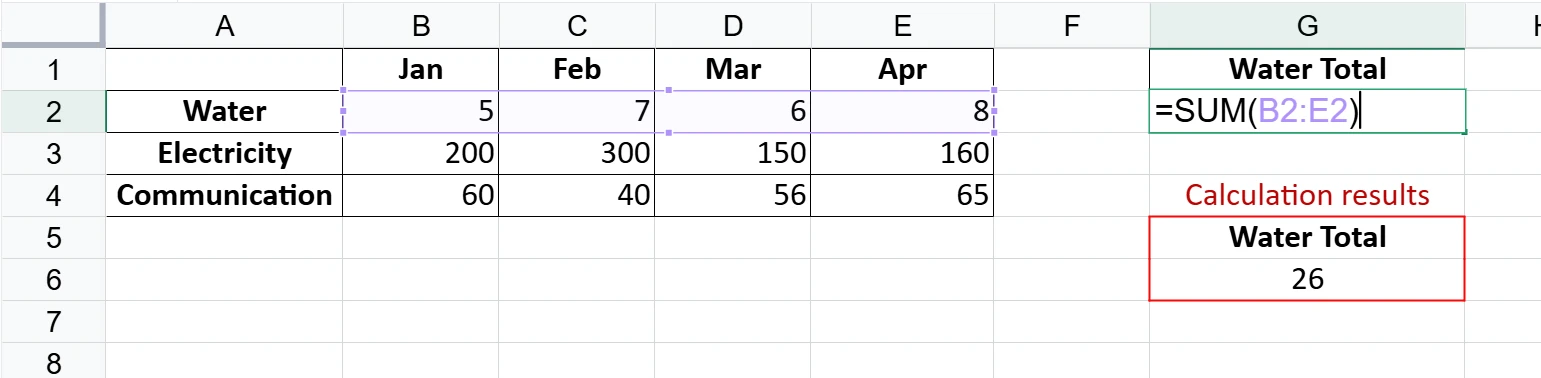
To find the sum of a certain region, just write=SUM(B2:E2), and Excel will automatically add up all the numbers in these four cells.
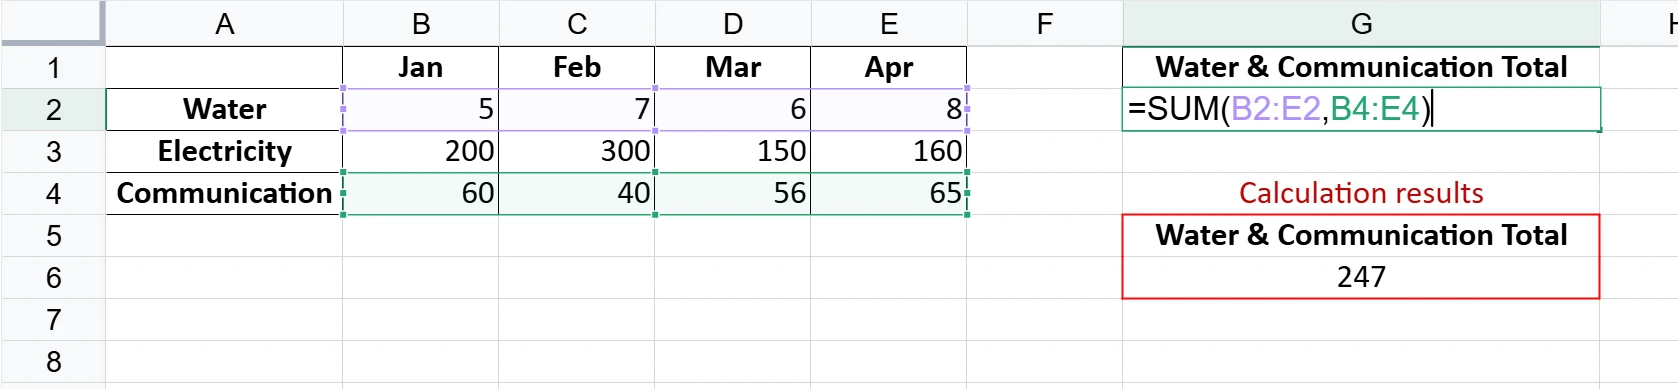
It can also add multiple areas at once, such as =SUM(B2:E2, B4:E4), the numbers in both ranges will be added together. This function isn't picky—it can add any numbers.
I use SUM most often to calculate total sales, total expenses, and total scores. It’s used so frequently that Excel has even added it to the toolbar—you can use it with just a single click on the Σ symbol.
AVERAGE Function
AVERAGE is a function that calculates the average.
Structure:=AVERAGE(range)
AVERAGE has saved me a lot of trouble. Before, when calculating the average, I had to add up the scores and then count the number of people; now, I can just use AVERAGE.
写 =AVERAGE(B3:E3)Excel automatically calculates the average of these ten cells, so I don't have to worry about addition or division.
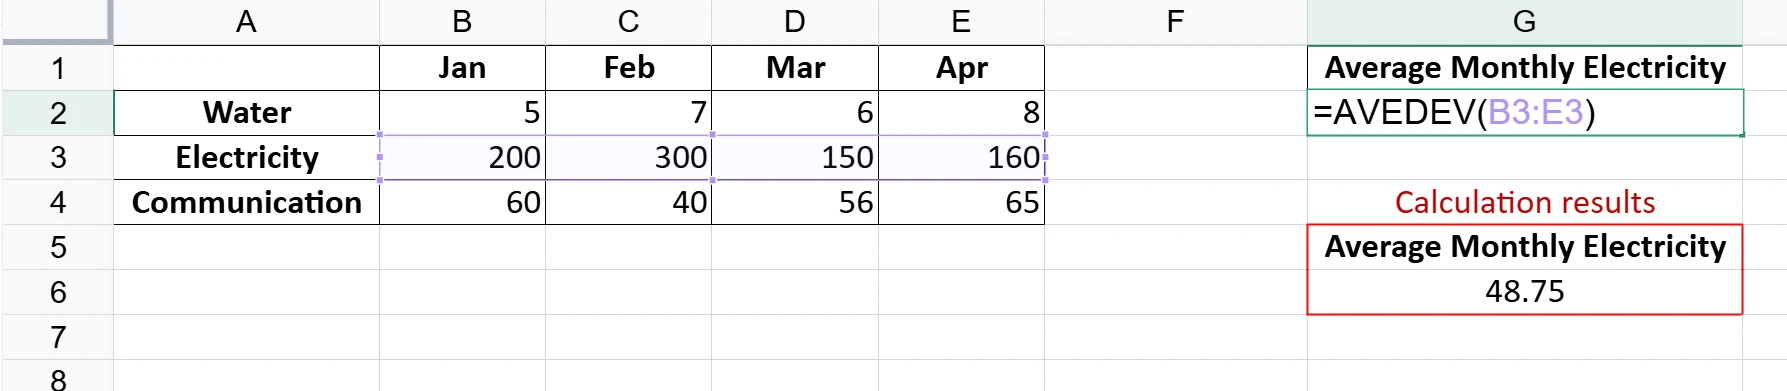
There’s one thing you should keep in mind: AVERAGE calculates only the average of numeric cells; it skips over text cells entirely. Sometimes this is a good thing, but other times it causes me to get the wrong result, so before using it, I always scan the data to see if there’s any text.
I often use it to calculate class averages, monthly average expenses, and daily average step counts—I’ve completely stopped calculating averages by hand.
COUNT Function
COUNT is a function that counts the number of cells containing numbers.
Structure:=COUNT(Range)
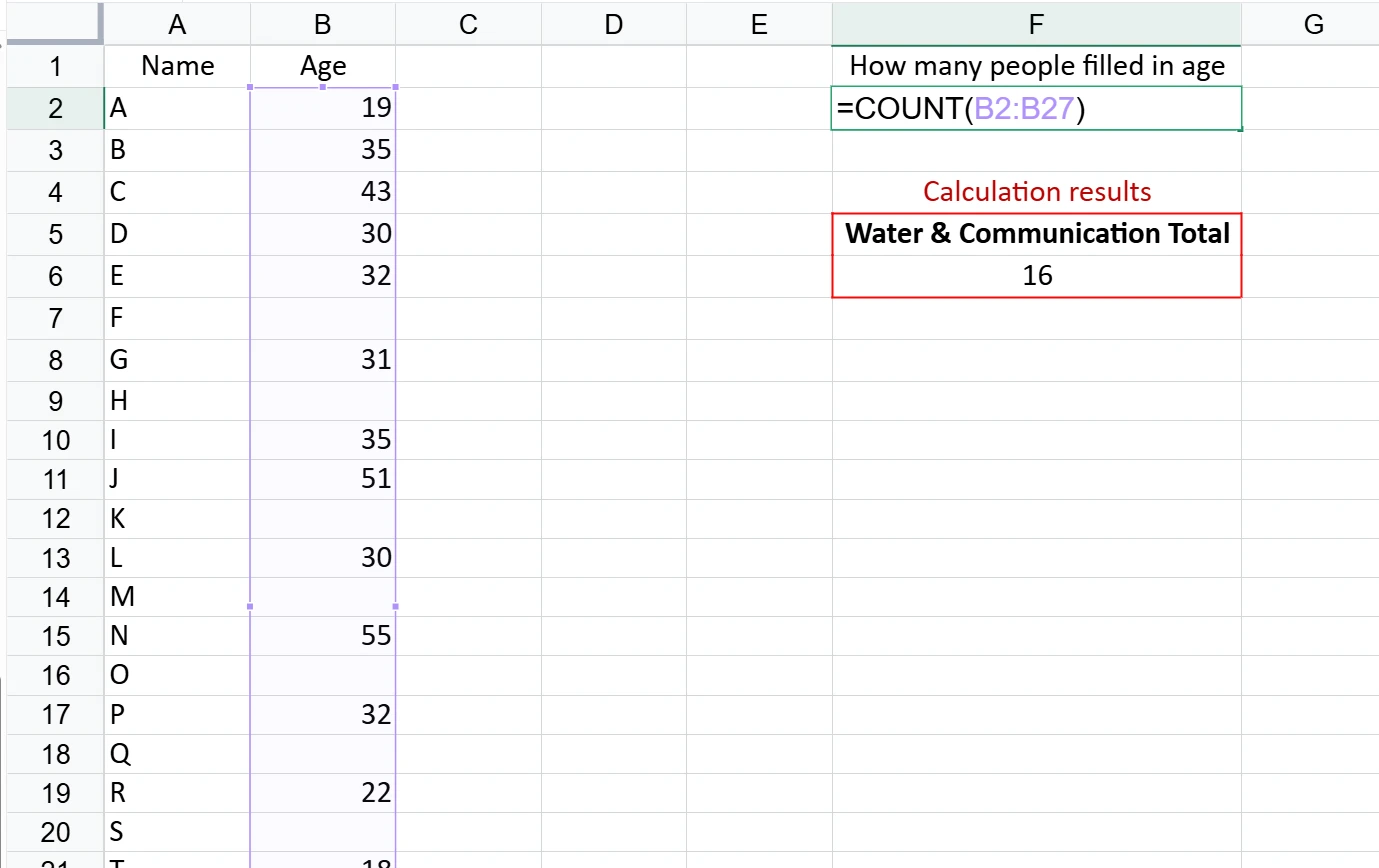
写 =COUNT(D1:D20)Excel will tell me how many of these twenty cells contain numbers. If five of them are empty or contain text, the COUNT function will return only fifteen.
It lets me quickly see exactly how many valid numbers there are in a column, which is especially useful when verifying data. For example, if you have a list and want to know how many people entered their age, just use the COUNT function to count the entries in the age column.
SUMIF Function
SUMIF is one of the most useful functions, in my opinion, because it adds only the numbers that meet the specified criteria.
Its structure is =SUMIF(criteria_range, criteria, sum_range)。
The "Condition Range" is the range of cells to be checked, the "Condition" is what I'm looking for, and the "Sum Range" is the range of cells to be summed.
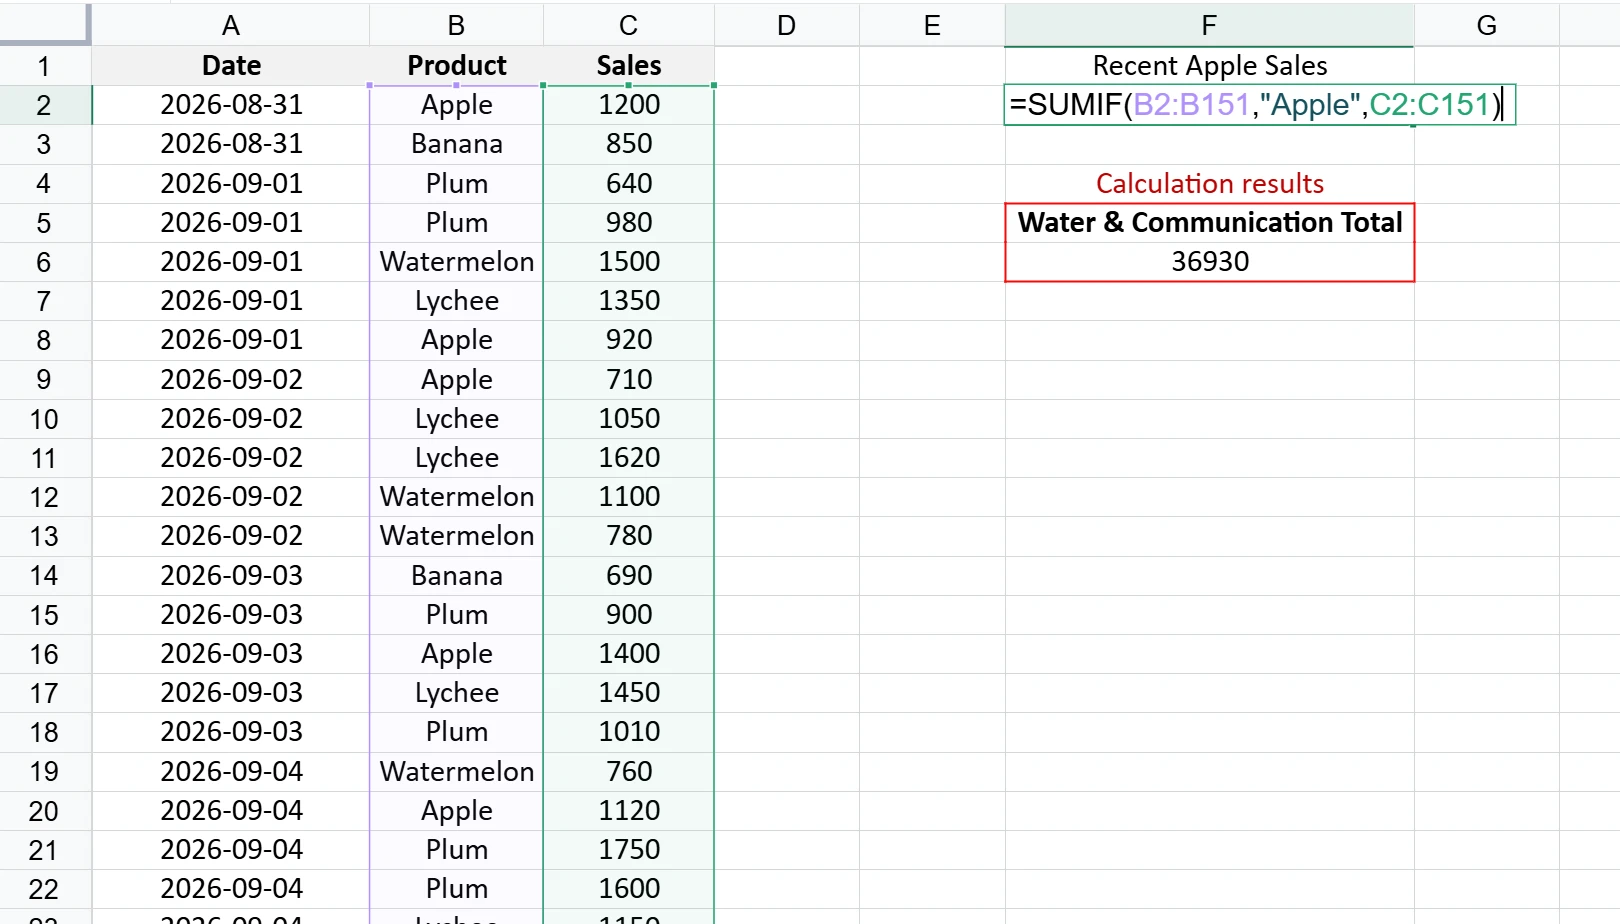
For example, in a table where Column B contains product names and Column C contains sales figures, if you only want to calculate the total sales for "Apple," you would write=SUMIF(B2:B151, "Apple", C2:C151). Excel will first look for "Apple" in Column A, then add up the corresponding numbers in Column B.
It's especially convenient for calculating categorical totals—you don't have to pick out the data and add it up one by one; a single formula takes care of the total for each category.
SUMIFS Function
SUMIFS is an enhanced version of SUMIF that allows you to use multiple criteria at the same time.
Structure:=SUMIFS(sum_range, criteria_range1, criteria1, criteria_range2, criteria2)。
Note that the sum range must be listed first—this is different from SUMIF, and I used to get them mixed up all the time when I first started.
For example, if you want to calculate the sales of "Apples" on "September 4," write=SUMIFS(C2:C151, B2:B151, "Apple", A2:A151, "2026-09-04"). Excel checks both Column A and Column B at the same time and adds only the numbers in Column C where Column A is "Apple" and Column B is "Beijing."
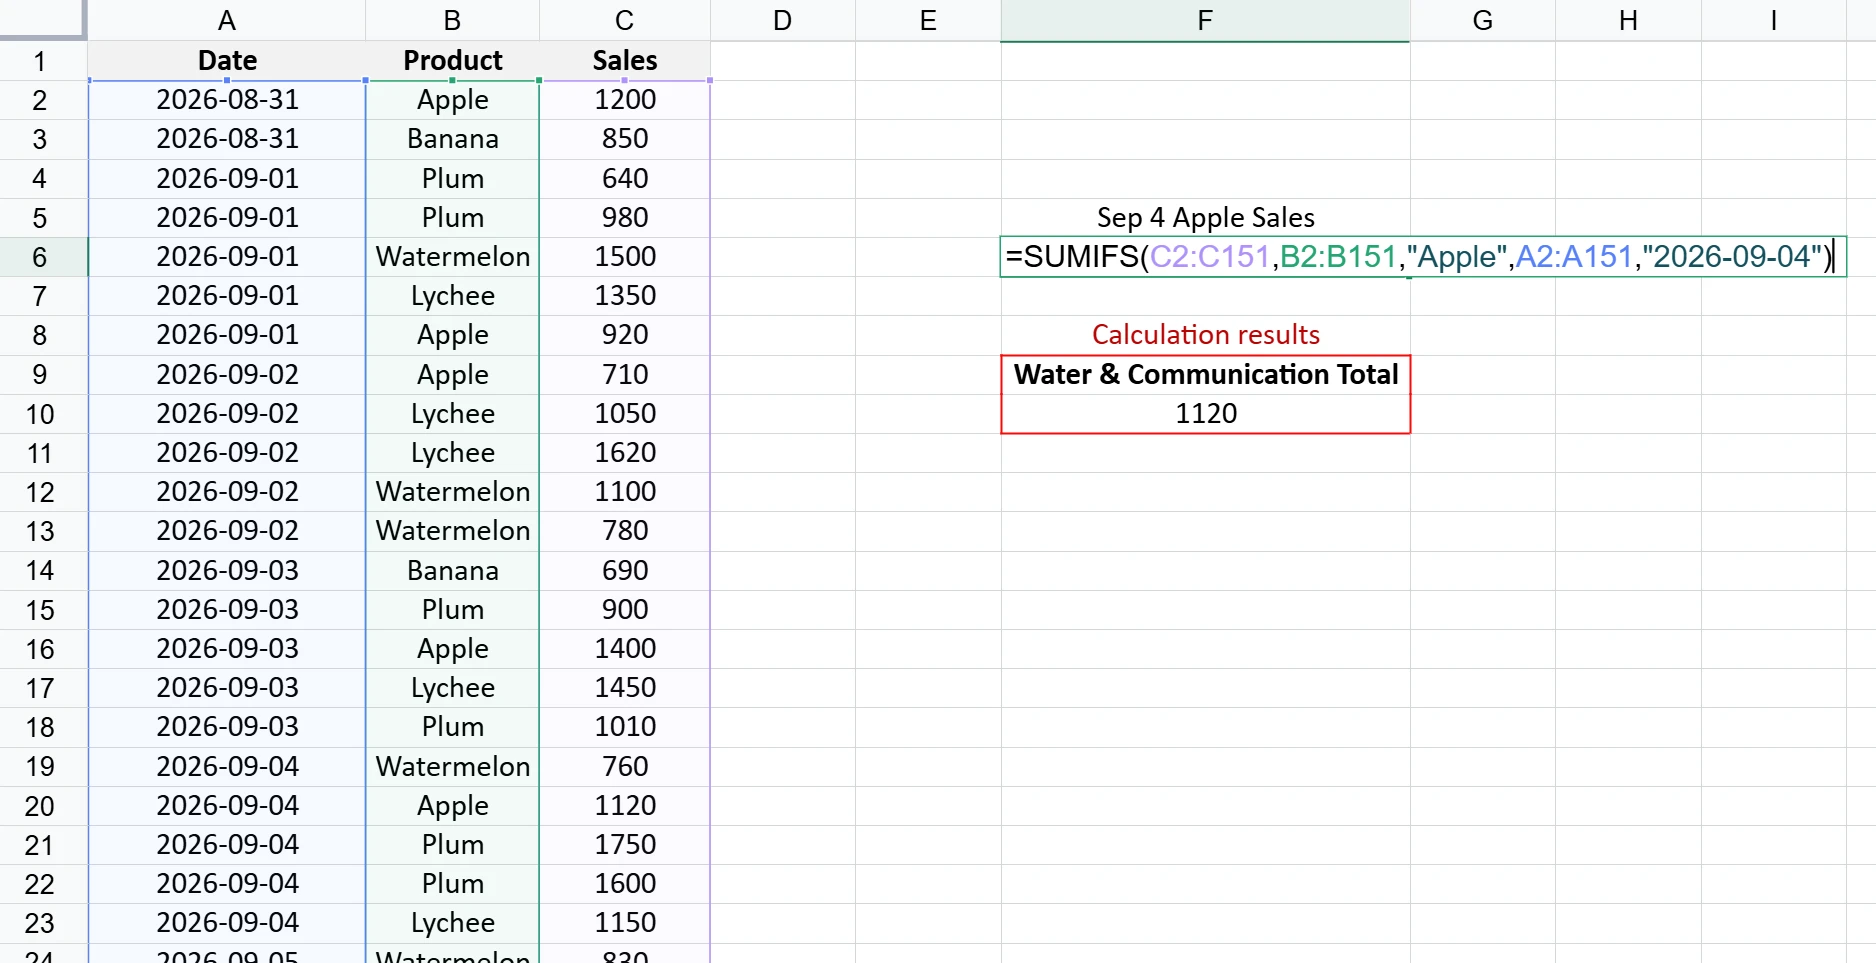
You can add as many pairs of conditions as you like—just enter as many pairs as you need. This makes it especially easy to perform multi-dimensional analysis; there’s no need to create a PivotTable—a single formula is all it takes to get the results.
How do I usually choose these five functions?
The method is simple: use SUM to add numbers; use AVERAGE to calculate the average; use COUNT to count the number of values; use SUMIF to add numbers based on a single condition; and use SUMIFS to add numbers based on multiple conditions.
These five functions cover 90 percent of my statistical needs in my daily work. I don’t have to memorize complicated formulas; I just need to remember what each function does and apply it directly when needed.
I suggest you open Excel and type it out yourself—it’s better to try it once than to watch it a hundred times. It’s okay if you make a mistake; Excel will show you where the problem is, and you can just fix it.
After using Excel for so many years, my biggest takeaway is that you don’t need a lot of tools—just enough to get the job done. These five functions are all I need for analyzing data, and I spend the time they save me sipping coffee.